
Section 13.4 Cardinality
Objectives
Analyze survey problems.
Often times we are interested in the number of items in a set or subset. This is called the cardinality of the set.
Definition 13.4.1.
The number of elements in a set is the cardinality of that set.
The cardinality of the set A is often notated as \(|A|\) or \(n(A)\text{.}\)
Example 13.4.2.
Let \(A= \{1, 2, 3, 4, 5, 6\}\) and \(B = \{2, 4, 6, 8\}\text{.}\)
What is the cardinality of \(B\text{?}\) Of \(A\cup B\text{?}\) Of \(A\cap B\text{?}\)
The cardinality of \(B\) is 4, since there are 4 elements in the set.
The cardinality of \(A\cup B\) is 7, since \(A\cup B= \{1, 2, 3, 4, 5, 6, 8\}\text{,}\) which contains 7 elements.
The cardinality of \(A\cap B\) is 3, since \(A\cap B = \{2, 4, 6\}\text{,}\) which contains 3 elements.
Example 13.4.3.
What is the cardinality of \(P\) = the set of English names for the months of the year?
The cardinality of this set is 12, since there are 12 months in the year.
Sometimes we may be interested in the cardinality of the union or intersection of sets, but not know the actual elements of each set. This is common in surveying.
Example 13.4.4.
A survey asks 200 people “What beverage do you drink in the morning”, and offers choices:
Tea only
Coffee only
Both coffee and tea
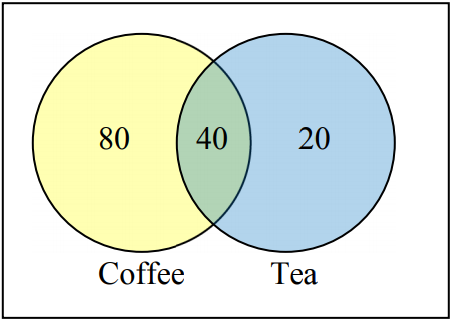
Suppose 20 report tea only, 80 report coffee only, 40 report both. How many people drink tea in the morning? How many people drink neither tea or coffee?
This question can most easily be answered by creating a Venn diagram. We can see that we can find the people who drink tea by adding those who drink only tea to those who drink both: 60 people.
We can also see that those who drink neither are those not contained in the any of the three other groupings, so we can count those by subtracting from the cardinality of the universal set, 200. \(200 – 20 – 80 – 40 = 60\) people who drink neither.
Example 13.4.5.
A survey asks: Which online services have you used in the last month?
Twitter
Facebook
Have used both
The results show 40% of those surveyed have used Twitter, 70% have used Facebook, and 20% have used both. How many people have used neither Twitter or Facebook?
Let \(T\) be the set of all people who have used Twitter, and \(F\) be the set of all people who have used Facebook. Notice that while the cardinality of \(F\) is 70% and the cardinality of \(T\) is 40%, the cardinality of \(F\cup T\) is not simply \(70\% + 40\%\text{,}\) since that would count those who use both services twice.
To find the cardinality of \(F\cup T\text{,}\) we can add the cardinality of \(F\) and the cardinality of \(T\text{,}\) then subtract those in intersection that we’ve counted twice. In symbols,
Now, to find how many people have not used either service, we’re looking for the cardinality of \((F\cup T)^c\) . Since the universal set contains 100% of people and the cardinality of \(F\cup T\) is 90%, the cardinality of \((F\cup T)^c\) must be the other 10%.
The previous example illustrated two important properties.
Theorem 13.4.6. Cardinality Properties.
Notice that the first property (13.4.1) can also be written in an equivalent form by solving for the cardinality of the intersection:
Example 13.4.7.
Fifty students were surveyed, and asked if they were taking a social science (SS), humanities (HM) or a natural science (NS) course the next quarter.
21 were taking a SS course
19 were taking a NS course
7 were taking SS and NS
3 were taking all three
26 were taking a HM course
9 were taking SS and HM
10 were taking HM and NS
7 were taking none
How many students are only taking a SS course?
It might help to look at a Venn diagram. From the given data, we know that there are 3 students in region \(e\) and 7 students in region \(h\text{.}\)
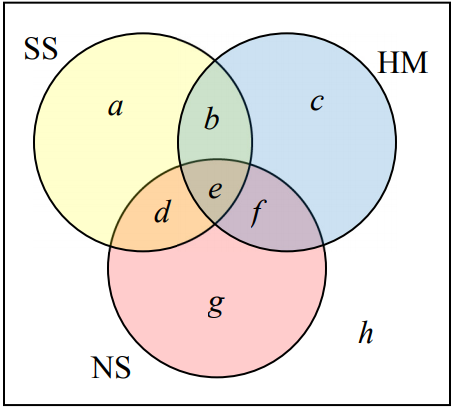
Since 7 students were taking a SS and NS course, we know that \(n(d)+n(e) = 7\text{.}\) Since we know there are 3 students in region 3, there must be
Similarly, since there are 10 students taking HM and NS, which includes regions e and f, there must be
Since 9 students were taking SS and HM, there must be \(9 – 3 = 6 \)students in region b.
Now, we know that 21 students were taking a SS course. This includes students from regions a, b, d, and e. Since we know the number of students in all but region a, we can determine that
8 students are taking only a SS course.
Try It Now 13.4.8.
One hundred fifty people were surveyed and asked if they believed in UFOs, ghosts, and Bigfoot.
43 believed in UFOs 44 believed in ghosts
25 believed in Bigfoot 10 believed in UFOs and ghosts
8 believed in ghosts and Bigfoot 5 believed in UFOs and Bigfoot
2 believed in all three
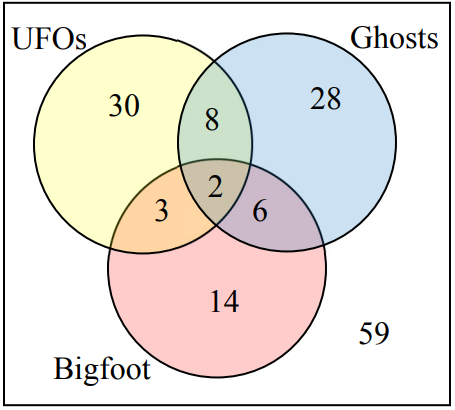
How many people surveyed believed in at least one of these things?
Starting with the intersection of all three circles, we work our way out. Since 10 people believe in UFOs and Ghosts, and 2 believe in all three, that leaves 8 that believe in only UFOs and Ghosts. We work our way out, filling in all the regions. Once we have, we can add up all those regions, getting 91 people in the union of all three sets. This leaves \(150 – 91 = 59\) who believe in none.
Exercises 13.4.1 Exercises
Let \(A=\{1,2,3,4,5\}\text{,}\) \(B=\{1,3,5\}\text{,}\) and \(C=\{4,6\}\text{.}\) Find the cardinality of the given set:
1.
\(n(A)\)
5.
2.
\(n(B)\)
3.
\(n(A\cup C)\)
6.
4.
\(n(A\cap C)\)
The Venn diagram here shows the cardinality of each set. Use this in #5-8 to find the cardinality of the given set.

5.
\(n(A\cap C)\)
5.
6.
\(n(B\cup C)\)
7.
\(n(A\cap B\cap C^c)\)
3.
8.
\(n(A\cap B^c\cap C)\)
9.
If \(n(G)=20\text{,}\) \(n(H)=30\text{,}\) and \(n(G\cap H)=5\text{,}\) find \(n(G\cup H)\text{.}\)
45.
10.
If \(n(G)=5\text{,}\) \(n(H)=8\text{,}\) and \(n(G\cap H)=4\text{,}\) find \(n(G\cup H)\text{.}\)
11.
A survey was given asking whether they watch movies at home from Netflix, Redbox, or a video store. Use the results to determine how many people use Redbox.
52 only use Netflix
24 only use a video store
48 only use Netflix and Redbox
10 use all three
62 only use Redbox
16 only use a video store and Redbox
30 only use a video store and Netflix
25 use none of these
136 use Redbox.
12.
A survey asked buyers whether color, size, or brand influenced their choice of cell phone. The results are below. How many people were influenced by brand?
5 said only color
16 said only brand
42 said color and brand
102 said all three
8 said only size
20 said only color and size
53 said only size and brand
20 said none of these
13.
Use the given information to complete a Venn diagram, then determine:
How many students have seen exactly one of these movies? and
How many had seen only Star Wars?
18 had seen The Matrix (“M”)
20 had seen Lord of the Rings (“LotR”)
14 had seen LotR and SW
6 had seen all three
24 had seen Star Wars (“SW”)
10 had seen M and SW
12 had seen M and LotR
8 had seen exactly one.
6 had only seen SW.
14.
A survey asked people what alternative transportation modes they use. Using the data to complete a Venn diagram, then determine:
What percent of people only ride the bus? and
How many people don’t use any alternate transportation?
30% use the bus
25% walk
10% ride a bicycle and walk
2% use all three
20% ride a bicycle
5% use the bus and ride a bicycle
12% use the bus and walk